When you want to quickly figure out a large volume of mixed information and data, including facts, ethnographic research, brainstorming ideas, user opinions, user needs, insights, and more, you can rely on an affinity diagram. It can help you sort information in an organized manner and make the root cause analysis.

This post will guide you to learn more about affinity diagrams. You can learn what an affinity diagram is, why it is useful, and how to make your affinity diagram in project management.
- Part 1. What Is an Affinity Diagram
- Part 2. How to Create an Affinity Diagram
- Part 3. FAQs of Affinity Diagram
Part 1. What Is an Affinity Diagram
An affinity diagram, also known as the K-J method, affinity chart, and affinity mapping, is a business tool that is mainly used to organize various ideas and information and is one of the seven management tools for planning. It is a collection of large amounts of data that are organized into groups or themes. It is usually the organized output from brainstorms, research, and meetings. All data are sorted into meaningful categories that are based on common relationships or themes.
The purpose of an affinity diagram
Affinity mapping requires you to cluster information in an organized manner. It can be an effective method to synthesize information and insights during the design process. An affinity diagram helps to organize information into groups of similar items, especially when you want to analyze qualitative data or observations.
The main purpose of an affinity diagram is to organize, generate, and consolidate all kinds of information concerning a process, product, complex issue, or problem. It gives a group a simple way to develop a system of thought about a complex issue or problem. Using an affinity diagram, you can handily generate ideas and organize them in a manner that clearly displays the various connections and relationships.
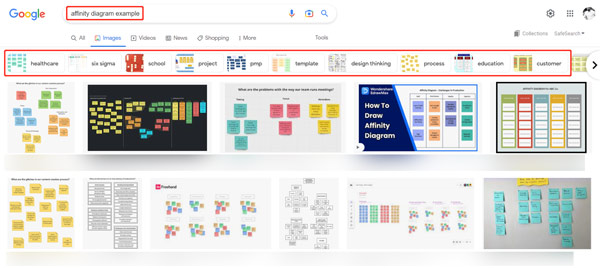
Affinity diagram examples
With a suitable affinity diagram example, you can quickly start your creative problem-solving. You can easily find many mature and ready-made affinity diagram templates on the internet. For instance, you can directly search for the affinity diagram example on a web browser like Chrome, Safari, or Edge to quickly located associated ones. Considering that affinity diagramming is an organic process, so you don’t need to restrict it to a specific example.
Part 2. How to Create an Affinity Diagram in Project Management
You should know that creating an affinity diagram is usually a group activity. You need to gather all ideas and information to produce more effective results. Before you make an affinity diagram, you’d better collect all different and useful insights, opinions, and perspectives. After that, you can start to create an affinity diagram in Word, Excel, or some diagram creators.
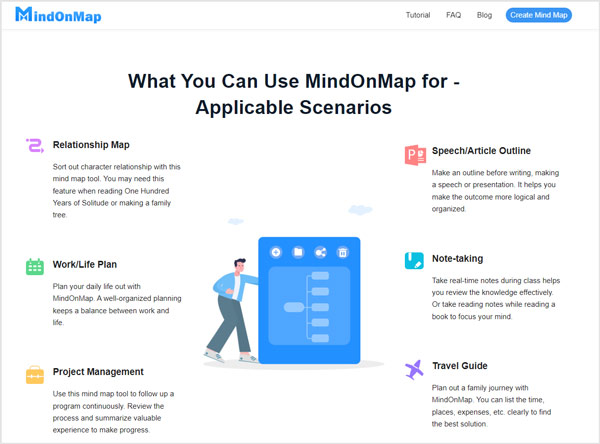
Here we strongly recommend the all-featured affinity mapping tool, MindOnMap, for you to easily generate an affinity diagram. It carries all commonly-used features to draw all types of diagrams, including affinity diagrams, mind maps, organizational charts, tree diagrams, fishbone diagrams, and more. You can free use it on any web browser to create your affinity diagram.
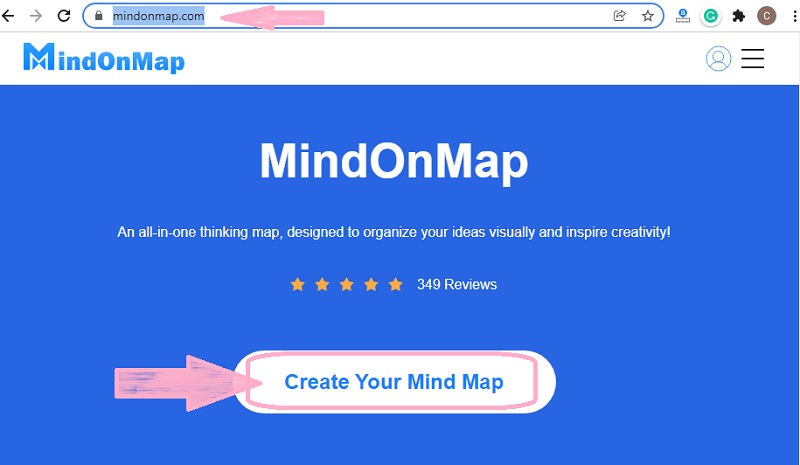
Step 1Open a web browser like Google Chrome, Safari, Firefox, Yahoo, IE, or Edge, search for MindOnMap, and then go to its official website. When you get to the page, click the Your Mind Map button. You need to sign in to an account like your Google account to use it for free.
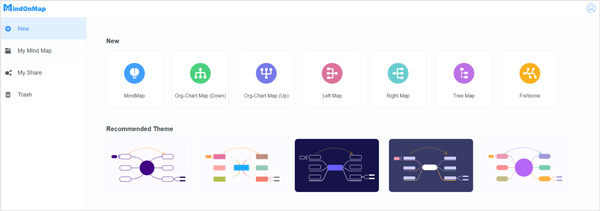
Step 2This online affinity diagram creator offers many read-made examples, themes, templates, and objects for you to quickly start your diagram drawing. You can select your preferred affinity diagram example to move on.
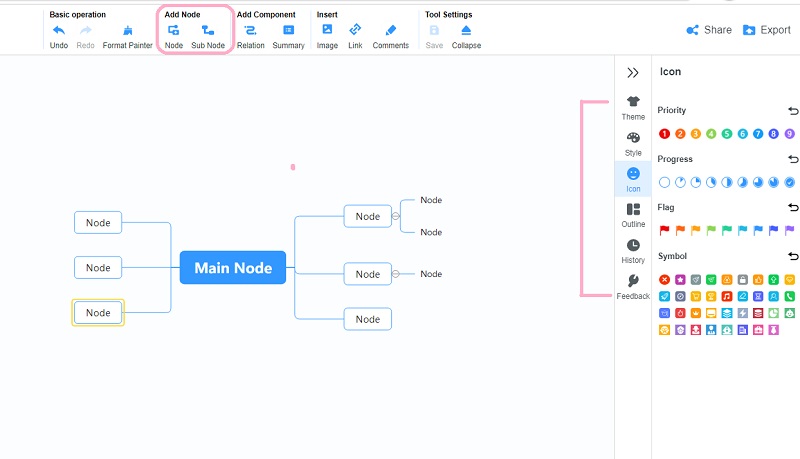
Step 3As a new user, you can check the on-screen instructions to know its key features. You can easily access all necessary tools, shapes, lines, nodes, icons, and other elements to create an affinity diagram.
Step 4After you finish the affinity diagram root cause analysis, you can choose to save it to your device or generate a link for sharing. You can click on the Share button in the top-right corner to easily share your creation with others and get further optimization.
Related to:Part 3. FAQs of Affinity Diagram
Question 1. When to use an affinity diagram?
There are many situations in that you will need to create an affinity diagram. When you are confronted with various information, many ideas, and facts, or you feel hard to grasp a complex issue. For instance, you are dealing with survey results and need to analyze verbal data, develop the relationships among ideas, and reduce attributes to categories.
Question 2. Can you make an affinity diagram in Microsoft Word?
Yes. Microsoft Word is designed with many basic types of graphics like drawing objects, SmartArt, charts, pictures, and clip art for you to easily create an affinity diagram. When you make a diagram in Word, you can use different shapes, curves, lines, WordArt, and other objects. Also, you are allowed to change and enhance these objects with colors, patterns, borders, and other effects to customize your created affinity diagram with ease. For example, you can open Word and go to the Insert tab, and then select Shapes in the Illustrations group.
Question 3. How to create an affinity diagram in Excel?
Open Excel and enter your data in sheets. You can follow a ready-made affinity diagram example to put all these data in suitable places. After that, you can use different colors or shapes to highlight them.
Conclusion
Affinity diagrams can help you work on a creative level to address difficult issues. Here in this post, we have covered what an affinity diagram is and how to create one in project management. If you have more useful tips on creating affinity diagrams, please share them with other readers in the comment section below.