When you encounter a serious problem at work or in life, it is important to explore all the facts that could cause it before you start to think about the solutions. So that you can solve the problem completely rather than just addressing part of it and keeping the problem running on and on.
The cause and effect diagram also called the fishbone diagram is possibly one of the most popular quality tools to illustrate the root cause of a certain problem. This guide will tell you everything you should know about it.

- Part 1: What Is Cause and Effect Diagram
- Part 2: How to Create a Cause and Effect Diagram
- Part 3: FAQs about Cause and Effect Diagram
Part 1: What Is Cause and Effect Diagram
A cause and effect diagram is a visual tool that refers to logically organizing possible causes of a specific problem. It graphically displays them in detail and shows causal relationships among theories. In one word, it is an effective way to clearly show the relationship between factors to study, processes, situations, and planning. As a diagram technique, it combines brainstorming with a type of mind map and pushes users to consider all possible causes of the problem but not just the obvious ones.
The cause and effect diagram is widely used in product development and troubleshooting processes, focusing on a conversation around a problem. Anyway, you can use it to:
1. Discover all possible causes of a problem.
2. Uncover bottlenecks in your processes.
3. Identify where and why a process stops working.
How to Construct a Cause and Effect Diagram
Although the cause and effect diagram is widely used across industries, it is difficult to tell how many types are there. However, one thing is clear, the steps to construct a cause and effect diagram.
Step 1Define the Effect
That is the first step to doing a cause and effect diagram. You must write down the effect. Plus, it must be advisable to spell out what is included and excluded.
Step 2Draw the Effect
Once you have an effect, place it on the right. It is usually enclosed in a box.
Step 3Identify and Draw Causes
This step involves brainstorming. You must identify all possible causes including the root one. It requires a team with a few individuals who are likely to dominate the conversation or process.
In the manufacturing industry, for example, it is referred to as the 6M:
Methods
Machines
Materials
Measurements
Mother Nature
Manpower
In the service industry, it is represented as the 4S:
Surroundings
Suppliers
Systems
Skill
In the marketing industry, cause and effect fishbone diagrams are described as the 7Ps:
Product
People
Process
Promotion
Price
Physical Evidence
Place
For other industries, it consists 4Ws:
What
Why
When
Where
Next, place each of the major causes in a box and connect it with the central line.
Step 4 Add Subsidiary Causes for Major Causes
The major causes are not isolated incidents. You also need to think about the subsidiary causes for them. Then draw the subsidiary causes and connect them with the associated lines.
Step 5 Add More Possible Causes
Continue to add possible causes until each major cause reaches a root one. A root cause has three characteristics. Firstly, it causes the problem that you are resolving. Secondly, it is controllable. Finally, the elimination of the root cause can resolve the problem or at least reduce the effect.
Step 6 Check Logical Validity
A cause and effect diagram may be very complicated and combined with several major causes and lots of subsidiary causes. Make sure that each chain makes logical and operational sense. You also need to check for the completeness of each main branch.
Part 2: How to Create a Cause and Effect Diagram
For beginners and average people, the wisest choice is looking for a powerful tool when creating a cause and effect diagram. MindOnMap, for instance, is the easiest way to convert your problem to a cause and effect analysis. It has some unique advantages. First of all, it is completely free to use. You cannot find any payment option on the webpage. As an online app, it does not ask you to install any software on your hard disk.
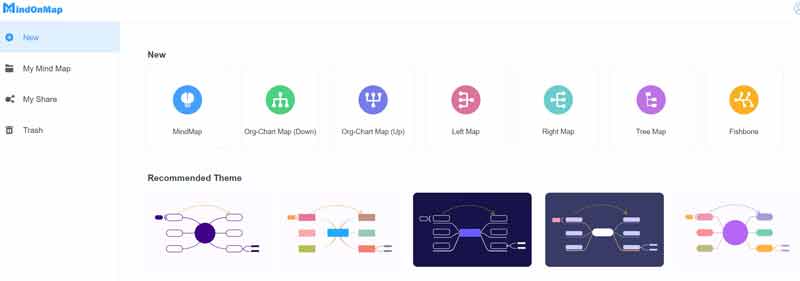
Step 1 Access https://www.mindonmap.com/ in a browser, and click the Create Your Mind Map button. When prompted, sign in to your account. If you do not have one, sign up with your email.

Step 2 Enter the New tab on the left sidebar, and choose the Fishbone option on the right side, which is another name for the cause and effect diagram.
Step 3 There is a main node on the page. You need to add other nodes by hitting the Node option in the Node Add section on the top menu bar. Or right-click the Main Node label and choose Add node to add more nodes.
Step 4 Next, arrange all the nodes according to your causes, effect, and subsidiary causes in the cause and effect diagram.
Step 5 To create a complete cause and effect diagram, you also need to add relation lines between the nodes. Select two nodes, locate the Nodes and Relationships section and choose Relation. Then you can change the style with the options on the right side.
Step 6 Finally, share the cause and effect diagram or export it to your hard drive. You can also save it online in your account.
Also Read:
10 Brilliant Mind Map Examples – Get You Inspired
How to Brainstorm with Mind Maps Easily
Part 3: FAQs about Cause and Effect Diagram
Why are cause and effect diagrams important?
A cause and effect diagram can determine the root cause or possible causes of a problem. It helps a team to identify and understand the underlying cause of a problem rather than the symptoms.
What are the 6 categories in a fishbone diagram?
The 6 categories include procedures, policies, place, product, people, and processes.
Can I create a cause and effect diagram in Word?
Yes, you can make cause and effect diagrams in MS Word using shapes, lines, and texts. However, there are more easy tools available.
Conclusion
Now, you should understand what is cause and effect diagram, the procedure to make one, and how to do it using MindOnMap. You can open your browser, and create a cause and effect diagram for your current problem. More questions? Please feel free to leave a message below.