If you are a project manager, you should be familiar with PERT charts, which is also called PERT diagram. Today, the development of all industries is done under various projects. Therefore, it is essential to manage projects and monitor the processes for stakeholders. Fortunately, modern visualization technology allows project managers and teams to demonstrate projects with charts and graphics. That is also why you should learn the PERT chart carefully following our guide.

Part 1: What Is PERT Chart
A PERT chart, which represents Program Evaluation Review Technique, is a visual presentation of the timeline of a project using rectangles and circles, which describe the milestones. As a project management planning tool, it was used to evaluate the Polaris submarine missile program by the US Navy at first. Currently, it is available to schedule, organize, and coordinate tasks within any project.
The Elements in a PERT Chart
1. Nodes describe the milestones or events in the project.
2. Arrows explain the sequence of events.
3. Fast-tracking refers to the tasks and activities that happen at the same time.
4. PERT event is the point when a task starts or completes.
5. Predecessor event occurs before events.
6. Slack represents the amount of time on a specific task or the whole project.
7. The critical path is the path from the start to the end point of an event.
8. Critical path activity means a task without slack.
9. The crash critical path represents the completion time of an event is shortened.
10. Lag time describes the earliest point when a task follows another.
11. Lead time is the amount of time to complete a task.
12. Expected time refers to the time to finish a specific task or entire project.
13. Optimistic time is the minimum amount of time to complete a task.
14. Pessimistic time is the maximum amount of time to finish a task.
15. Most likely time is the best estimation of time to complete a task.
Benefits of PERT Charts
1. A PERT chart helps project managers to estimate the time, resources, and materials indispensable for a project.
2. Stakeholders can understand a project clearly including the milestones, workflows, and more.
3. Facing a large or complicated project, a PERT chart allows a project manager to work with a team seamlessly.
4. When making a PERT chart, the project manager can improve the estimation, project management, and workflow.
5. It describes the deadlines of each task and the whole project and ensures the project is completed on time.
How to Read a PERT Chart?
A PERT chart uses circles or rectangles to describe events, tasks, or milestones, which are called nodes. These nodes are linked by vectors or lines that represent the sequence of tasks. You can also learn the estimation of times and deadlines for tasks and the whole project.
The Best PERT Chart Examples
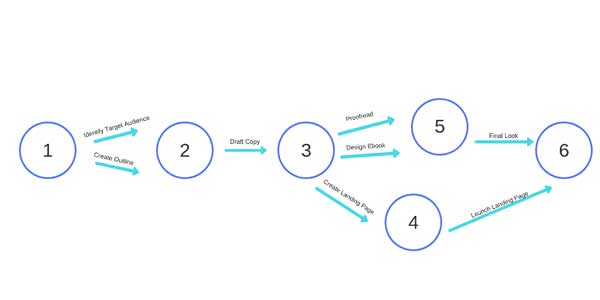
Example 1:
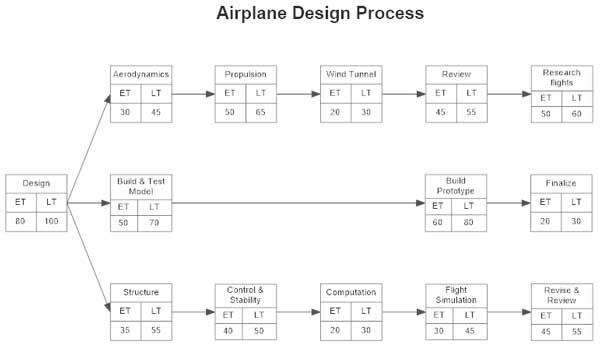
Example 2:
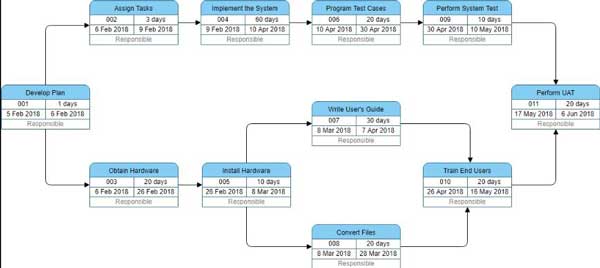
Example 3:
Part 2: How to Make a PERT Chart
To make a PERT chart, you need to follow 5 steps. Firstly, identify the tasks, milestones, or events in your project. Secondly, define task dependencies and relationships between each other. Thirdly, arrange and connect tasks. The fourth step is to estimate the times for the project and tasks. The last step is to manage task progress. Now, you have prepared all of them. The last thing you need to do is to visualize the project and tasks.
MindOnMap is the best PERT chart maker online. It allows you to draw charts without installing any software on your desktop. It is completely free to use without asking you to subscribe to any plan. More importantly, it offers a wide range of templates to help you simplify the job. Here we demonstrate how to draw a PERT chart online for free.
Step 1 Visit the best chart maker in your browser, and sign into your account. You can make an account for free.

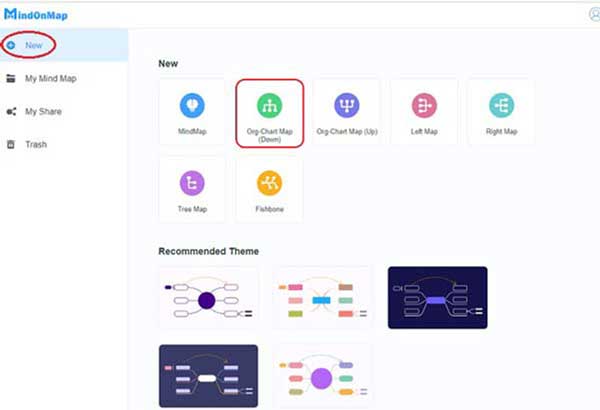
Step 2 Press the Create Your Mind Map button to open the dashboard page. Click the New tab from the left sidebar, choose an appropriate template, and enter the drawer page.
Step 3 Click the Node button in the Add Node section on the top ribbon to add nodes on the PERT chart. You can add sub-nodes to the chart. Double-click on one node, and enter the task label. Do the same to other nodes.

Step 4 Next, add relationships to these nodes by hitting the Relation button. You can also insert images, links, and other elements into the chart.
Step 5 To customize the appearance of the chart, click and expand the toolbar on the right side. Here you can change colors, shapes of nodes, font, and more based on your preference.
Step 6 Finally, click the Export button, choose a proper format, and download the PERT chart. Or you can share the chart on the internet by hitting the Share button.
Further Reading:
Organizational Chart Overview and 3 Best Org Chart Creators
5 Best Flowchart Makers of 2026
Part 3: FAQs about PERT Chart
When to use a PERT chart?
When a project manager needs to determine a project's critical path, display the relationships or sequence of tasks in a project, estimate the amount of time, and prepare for a large project, a PERT chart is the best choice.
What is the difference between the PERT chart and the Gantt chart?
Both PERT charts and Gantt charts are popular visual graphics for project management. Both of them illustrate tasks in a project. However, PERT charts are used before a project starts while Gantt charts are used during a project.
Can I make a PERT chart in Excel?
Yes. To create a PERT chart in Excel, select the shape from basic flowchart shapes in the symbol library and drag it onto the drawing canvas. Then add text within the shape, and draw the relationships between the tasks.
Conclusion
Based on the introduction above, you should understand what a PERT chart is, why you need a PERT chart, when to use it, and how to make a chart for your project. MindOnMap can save you time when making a PERT chart for project management. If you have other questions about this kind of chart, please feel free to write them down.