Just like Windows computer owns the Task Manager feature, there is also a similar feature on Mac, which is named Activity Monitor. It can help you monitor your Mac performance and speed up your Mac when it runs slowly. Here in this article we will teach you how to find this system monitor on your Mac and how to use it to maintain your Mac to avoid different problems. You can also get a more powerful alternative to manage your Mac easily.

- Part 1. What is Activity Monitor and Where Is It on Mac?
- Part 2. How to Use Activity Monitor?
- Part 3. The Best Alternative to Activity Monitor
Part 1. What is Activity Monitor and Where Is It on Mac?
Activity Monitor shows the processes running on your Mac in real-time, which includes processes, disk activity, memory usage, and more, so you can have intuitive knowledge about how each program is affecting your Mac' s activity and performance.
To access Activity Monitor on Mac, there are two easy ways. The first method is using the Spotlight.
- 1. Press Command + Space bar to get the Spotlight search light.
- 2. Type in "Activity Monitor" and tap the Enter key.
- 3. Select the Activity Monitor when it comes up on your screen. This will take you to the app.
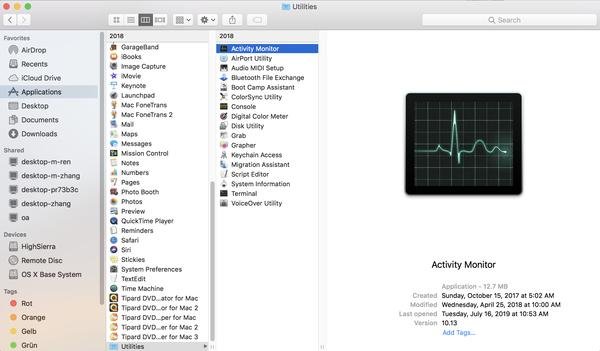
Another way to open this Task Manager on Mac is to navigate to Finder > Applications > Utilities, then double click Activity Monitor to launch it.
Part 2. How to Use Activity Monitor?
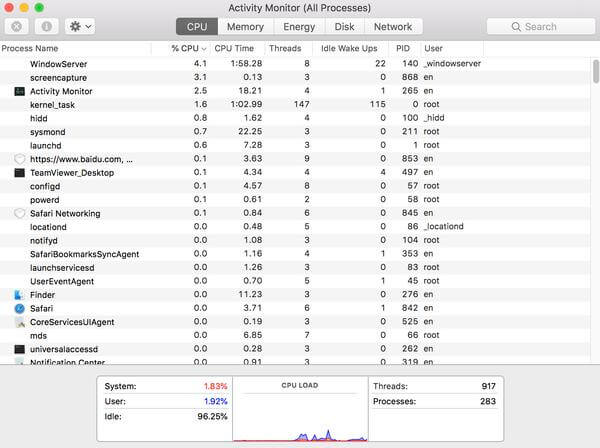
When you launch Activity Monitor, you will see five categories in the top of the window, they are CPU, Memory, Energy, Disk, and Network. They are the main system monitor indicators and will give you valuable information for troubleshooting purpose. Each pane shows the real-time statistics and graphs of resources usage over time.
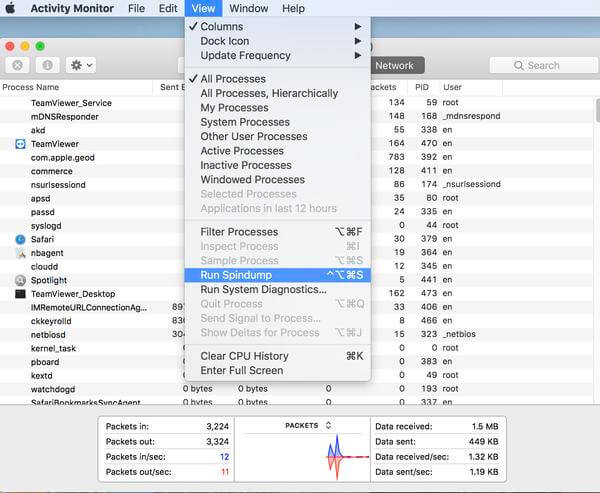
By default, Activity Monitor shows the processes running for the currently logged-in user. You can change this by clicking View > All Processes on the top of your screen.
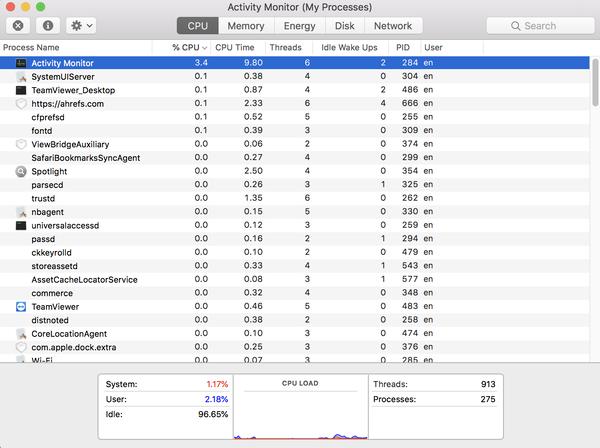
CPU
The CPU pane shows how each process uses your computer's processor. You will see what percentage of the total CPU a process is occupying (%CPU), how long it has been active (CPU Time), number of times a process awoke from the sleep state (Idle Wake Ups), and more. Besides, at the bottom, you'll also see the percentage and graph of your CPU used by the System (red) and User (blue). For more information, please check as below:
• System: The percentage of CPU capability currently used by system processes, which are processes that belong to macOS.
• User: The percentage of CPU capability currently used by apps that you opened, or by the processes those apps opened.
• Idle: The percentage of CPU capability not being used.
• CPU Load: The percentage of CPU capability currently used by all System and User processes. The graph moves from right to left and updates at the intervals set in View > Update Frequency. The color blue shows the percentage of total CPU capability currently used by user processes. The color red shows the percentage of total CPU capability currently used by system processes.
• Threads: The total number of threads used by all processes combined.
• Processes: The total number of processes currently running.
If there is any app performs weird, occupies much CPU, or becomes unresponsive or crashes, you can force quit this app by doing so: select the app and choose View > Quit Process, then click "Force Quit" button, or click the X button at the top of the toolbar to quit the process.
Memory
The Memory pane indicates how much RAM your Mac is using. You can get more valuable information to help you diagonose the performance issue of your Mac from the bottom of the Memory pane.
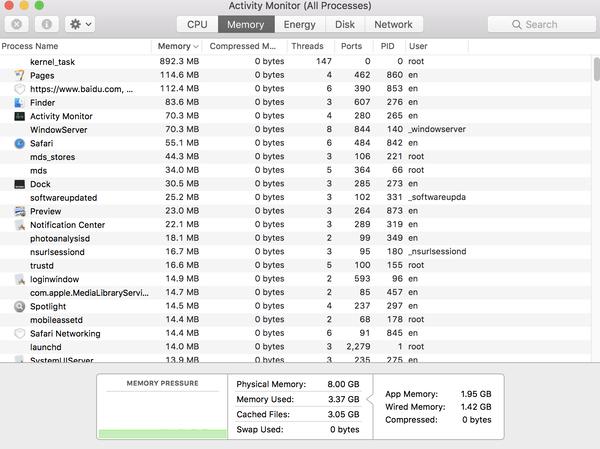
Memory Pressure: The Memory Pressure graph presents the availability of memory resources through different colors. Green means that there are sufficient memory resources available. Yellow indicates that your memory resources are still available but are being tasked by memory-management processes, such as compression. While Red is warning you that your memory resources are depleted, and macOS is using your startup drive for memory. To make more RAM available, you can quit one or more apps or install more RAM. This is the most important indicator that your Mac may need more RAM.
• Physical Memory: The amount of RAM installed on your Mac.
• Memory Used: The total amount of memory currently used by all apps and macOS processes. It consists of three parts: App Memory, Wired Memory and Compressed.
App Memory: The total amount of memory currently used by all the apps and their processes.
Wired Memory: Memory that can't be compressed or paged out to your startup drive, so it must stay in RAM.
Compressed: The amount of memory in RAM that is compressed to make more RAM memory available to other processes. Usually your Mac compresses the content used by less active processes to free up space for more active ones.
• Cached Files: Memory that was recently used by apps and is now available for use by other apps. For example, if you've been using Mail and then quit Mail, the RAM that Mail was using becomes part of the memory used by cached files, which then becomes available to other apps. If you re-launch the Mail app before its cached-files memory is used (overwritten) by another app, it will open more quickly because that memory is quickly converted back to app memory without having to load its contents from your startup drive. If you need to clear some processes to gain more RAM, you can clear useless cache files on Mac, especially cache files generated by apps that you seldom use.
• Swap Used: The space used on your startup drive by macOS memory management. It's normal to see some activity here. As long as memory pressure is not in the red state, macOS has memory resources available.
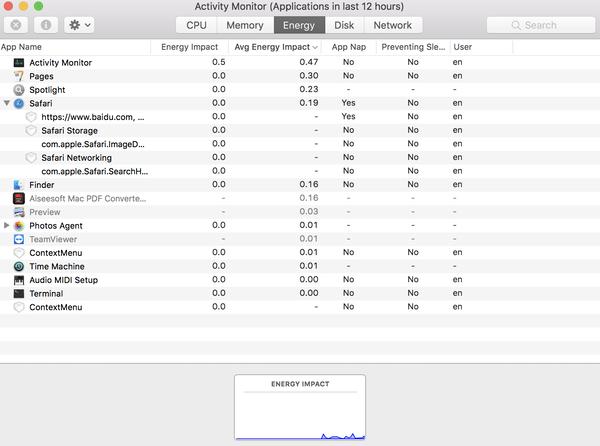
Energy
The Energy pane shows overall energy use and the energy used by each app. Check the meaning of each parameter as below.
- • Energy Impact: A relative measure of the current energy consumption of the app. Lower numbers are better. A triangle to the left of an app's name means that the app consists of multiple processes. You can click the triangle to see details about each process.
- • Avg Energy Impact: The average energy impact for the past 8 hours or since the Mac started up, whichever is shorter.
- • App Nap: Apps that support App Nap consume very little energy when they are open but not being used. For example, an app might nap when it's hidden behind other windows, or when it's open in a space that you aren't currently viewing.
- • Preventing Sleep: Indicates whether the app is preventing your Mac from going to sleep.
Disk
The Disk pane shows the amount of data that each process has written to your disk and read from your disk. It also shows "reads in" and "writes out" (IO) information at the bottom of the Disk pane, which is the number of times that your Mac accesses the disk to read and write data.
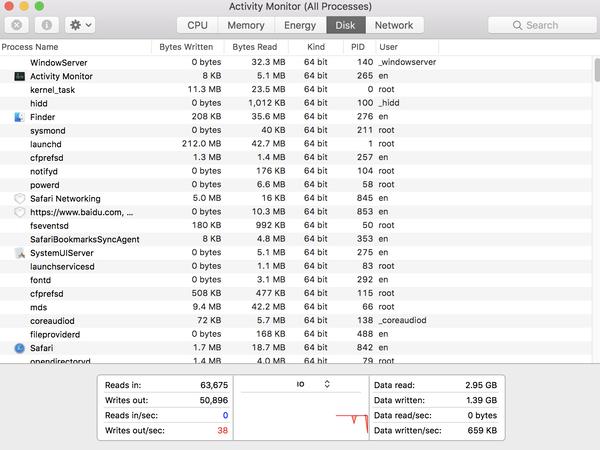
The color blue shows either the number of reads per second or the amount of data read per second. The color red shows either the number of writes out per second or the amount of data written per second. You should pay close attention to the number of reads or writes and observe how your system accesses the read or write data.
Network
The Network pane implies how much data your Mac is sending and receiving over your network. You are able to identify which processes are sending or receiving the most data with the Network information.
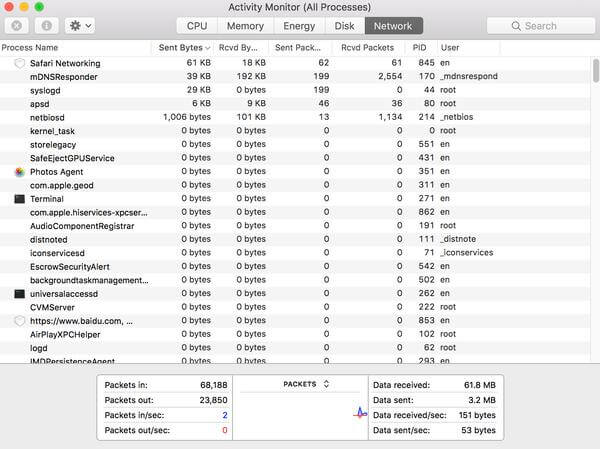
The information at the bottom of the Network pane shows total network activity across all apps. The graph moves from right to left and updates at the intervals set in View > Update Frequency. The graph also includes a pop-up menu to switch between showing packets or data as a unit of measurement. The color blue shows either the number of packets received per second or the amount of data received per second. The color red shows either the number of packets sent per second or the amount of data sent per second.
Part 3. The Best Alternative to Activity Monitor
It seems that it's a little difficult to understand every information of the Mac system monitor indicates, so here we recommend you an easy way to monitor your Mac performance and clean Mac to gain more space. Apeaksoft Mac Cleaner is a smart and professional Mac management tool that can do you a great favor to clean junk files, large and old files, unneeded cache files, duplicate files/folder, uninstall unwanted apps, and keep an eye on your Mac performance like battery status, memory usage, CPU usage and disk utilization easily. You can check its powerful features below.
- Remove junk files, unnecessary/old/large files on Mac.
- Clean email attachments and unneeded iTunes backups.
- Find and remove duplicate photos, files or folders.
- Uninstall seldom-used apps and its associated files thoroughly.
- Monitor Mac performance in disk utilization, memory usage, battery status, and CPU usage to get a sketch of your Mac status and health.
Conclusion
The Activity Monitor on Mac can help you know better about every process runs on your computer, so that you can take actions timely when you find there are apps running improperly to make your Mac performs normally. However, it requires you to know some computer technology and it's more time-consuming. If you want to monitor your Mac more conveniently and quickly, you can try the best alternative to Activity Monitor: Mac Cleaner, it ensures 100% security to speed up your Mac system and help you monitor Mac performance in real time.